Chesaning Twp Real Estate
14 active listings · 47 sold in the past 12mo
$182,400
Median List Price
47
Sold (past 12mo)
70
Avg Days on Market
+5.0%
HFGⓘ
Household Formation Gap (HFG) is a secondary market indicator that measures hidden housing demand created by shrinking household sizes. As average household size decreases — due to divorce, single living, empty nesting, delayed marriage — more housing units are needed even without population growth. HFG compares the estimated number of households needed today versus 15 years ago: (population ÷ avg household size). This is a demographic trend signal, not a primary market indicator like income-based affordability or comparative market analysis. Source: U.S. Census Bureau, American Community Survey 5-Year Estimates (2009–2023), Tables B01003, B25010, B25001.
Your Chesaning Twp Realtor
Alexander Munro
Broker of Record · MI License #6502405404
Direct-to-broker representation for buyers and sellers in Chesaning Twp and across Southeast Michigan. No team handoffs, no junk fees, full media included on every listing. Research-first approach grounded in MLS, public records, and on-the-ground knowledge of the local market.
Active Listings
Loading map…
Market Dashboard
Homes for Sale(14)
View all with filters →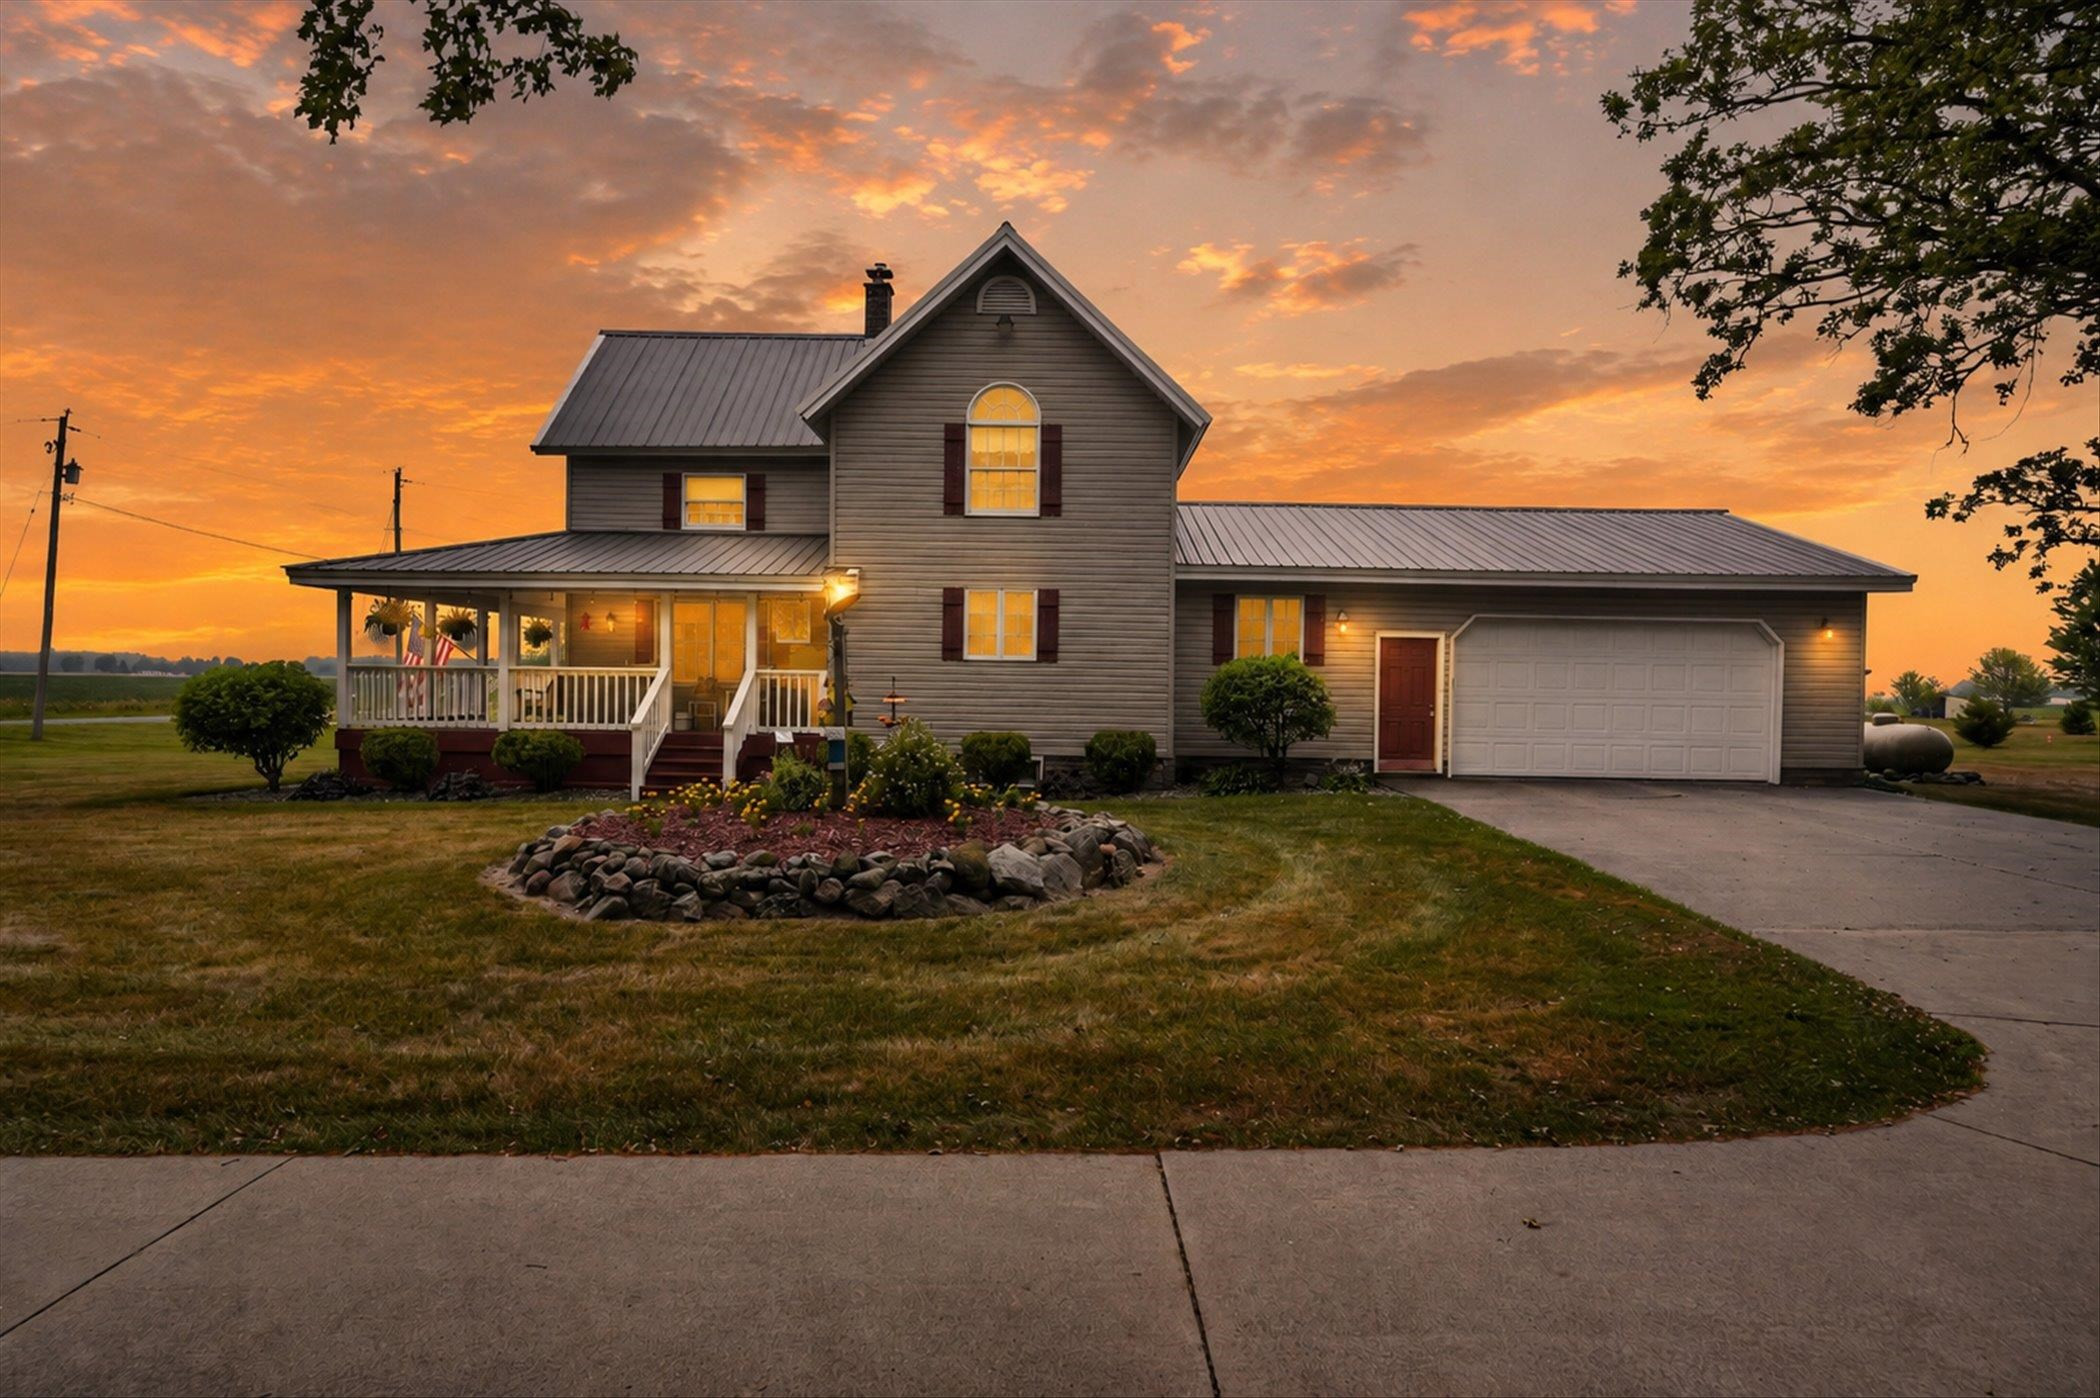
For Sale
1/62
$359,900
18500 Stuart Road, Chesaning, MI 48616
3 bd2 ba2 ac
Single Family
For Sale
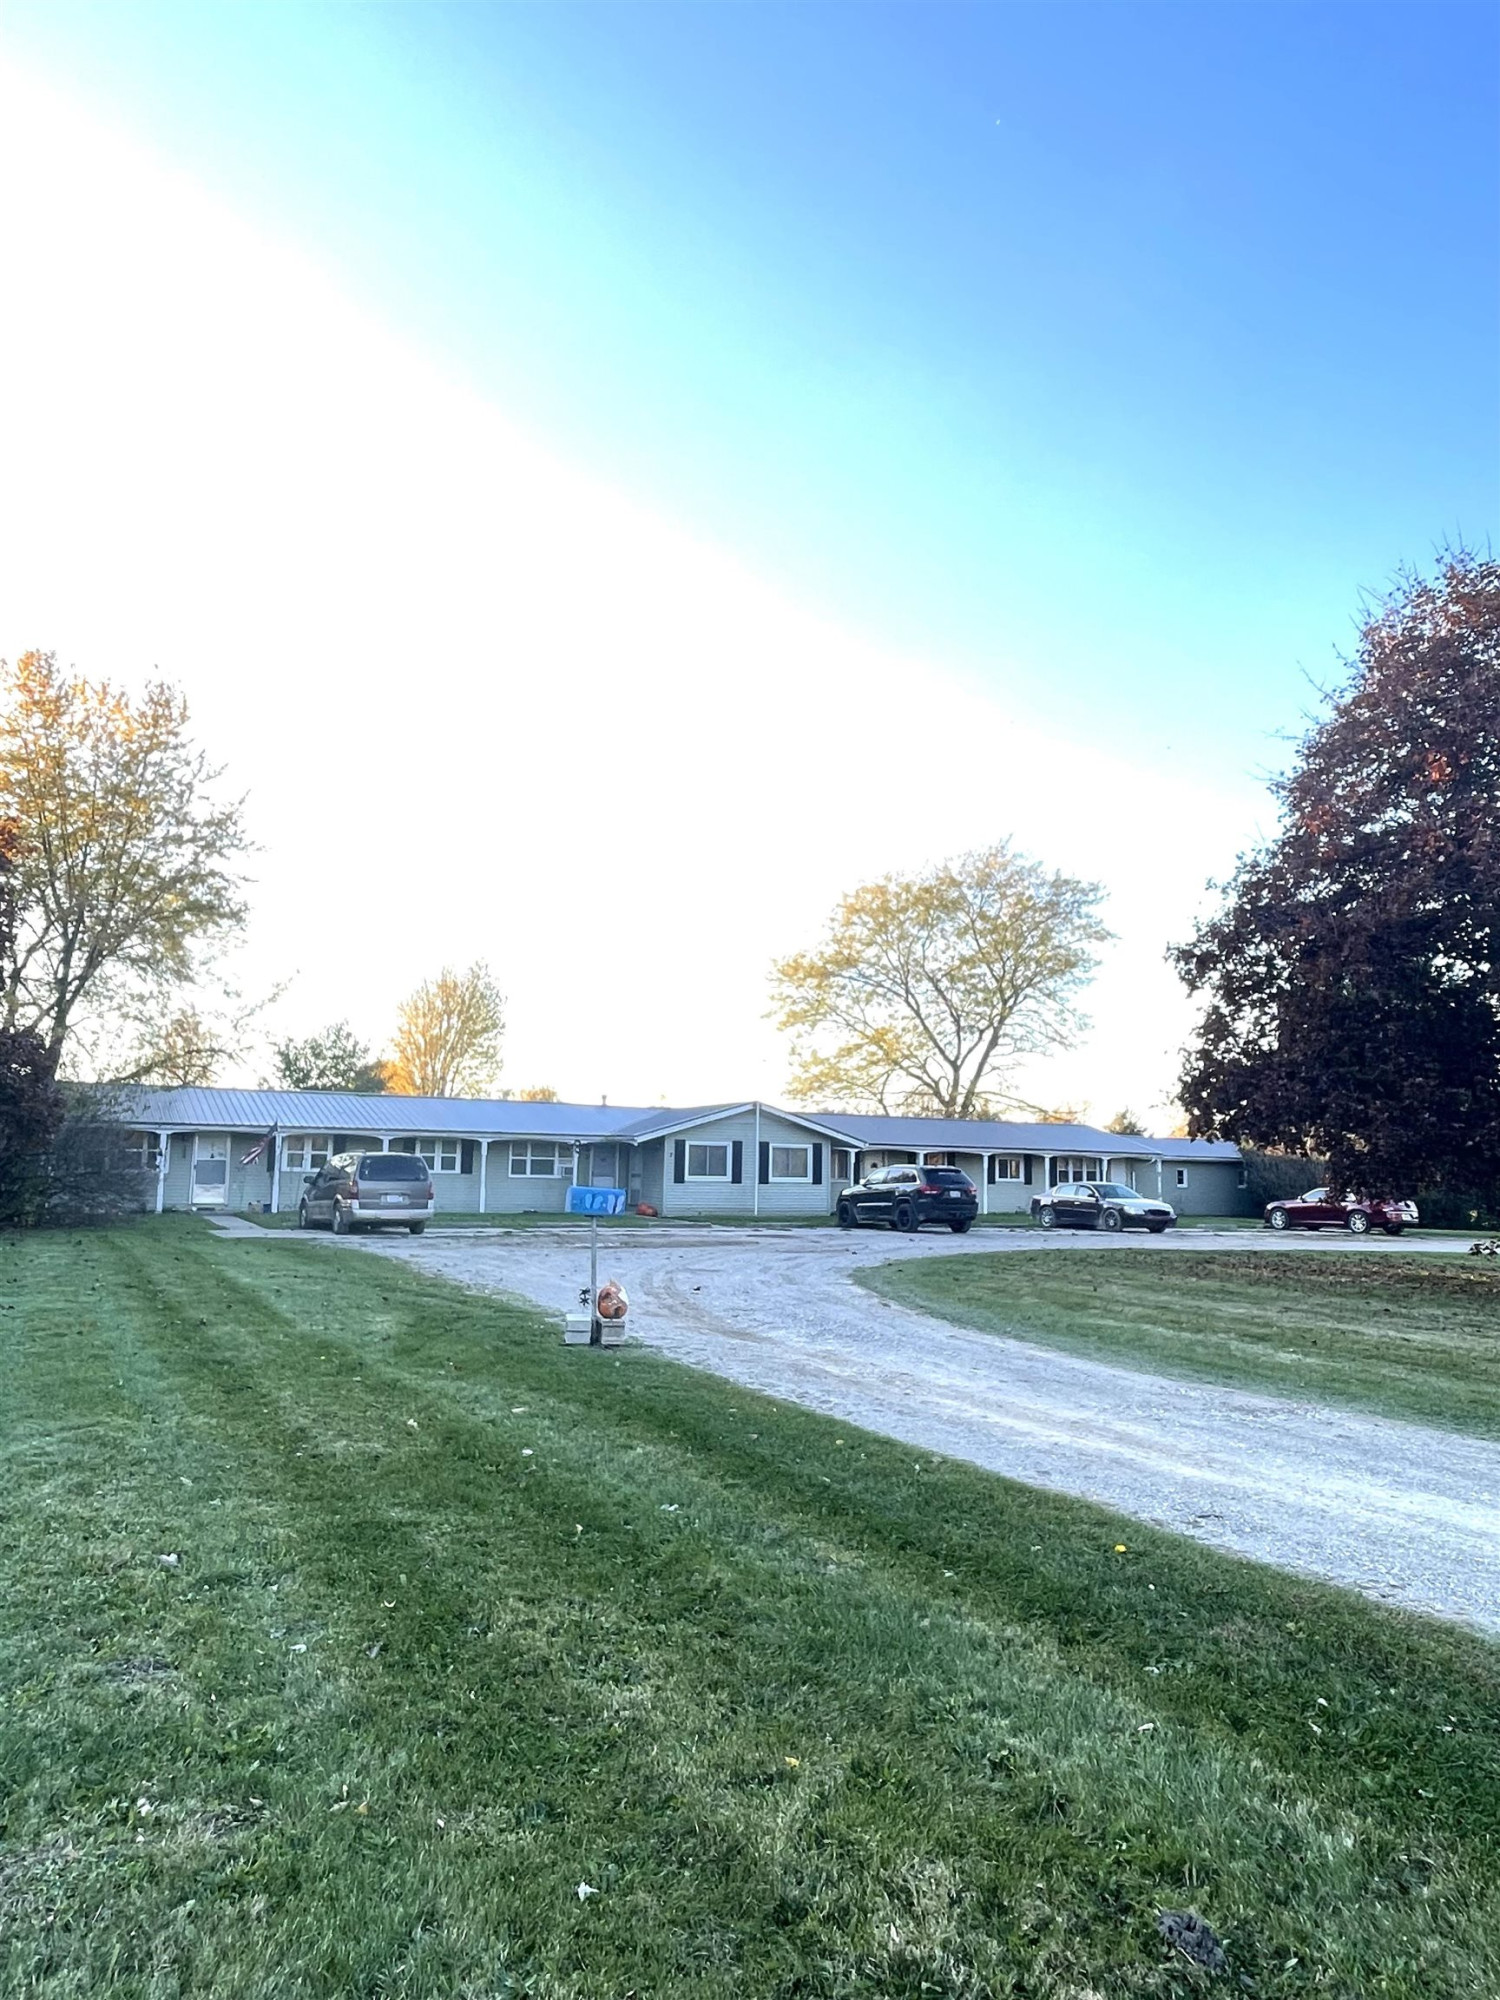
1/18
$354,999
16350 Oakley Road, Chesaning, MI 48616
Built 19503.50 ac
Multi-Fam

Under Contract
1/31
$334,000
17120 Stuart Road, Chesaning, MI 48616
3 bd2 ba2 ac
Single Family
For Sale
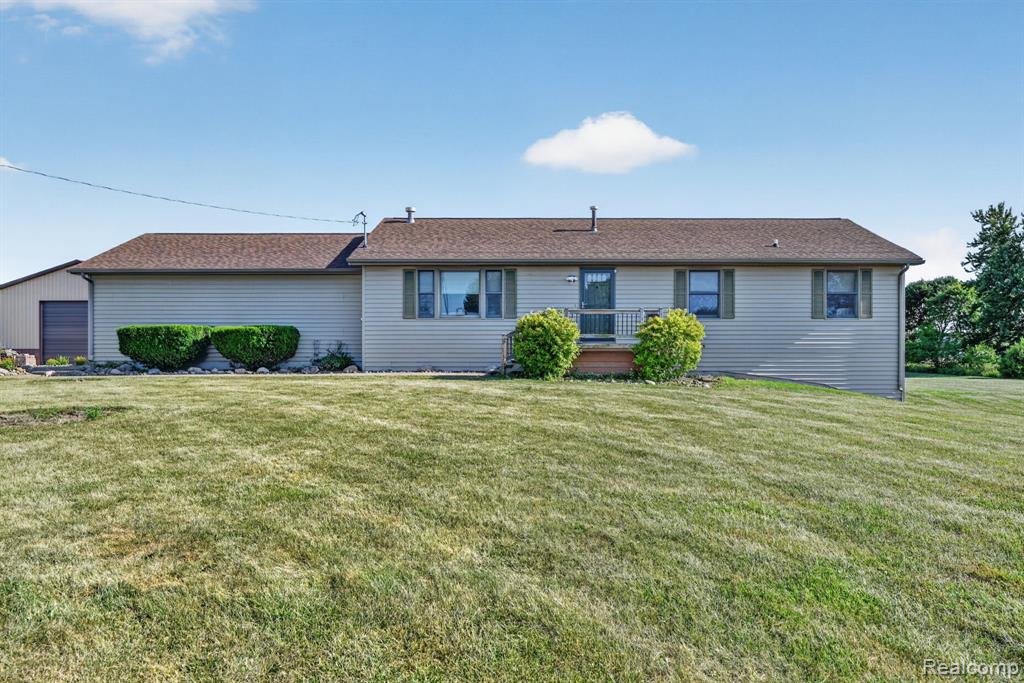
1/74
$312,000
9889 Ditch Road, Chesaning, MI 48616
3 bd3 ba1,900 sqft1.73 ac
Single Family
For Sale
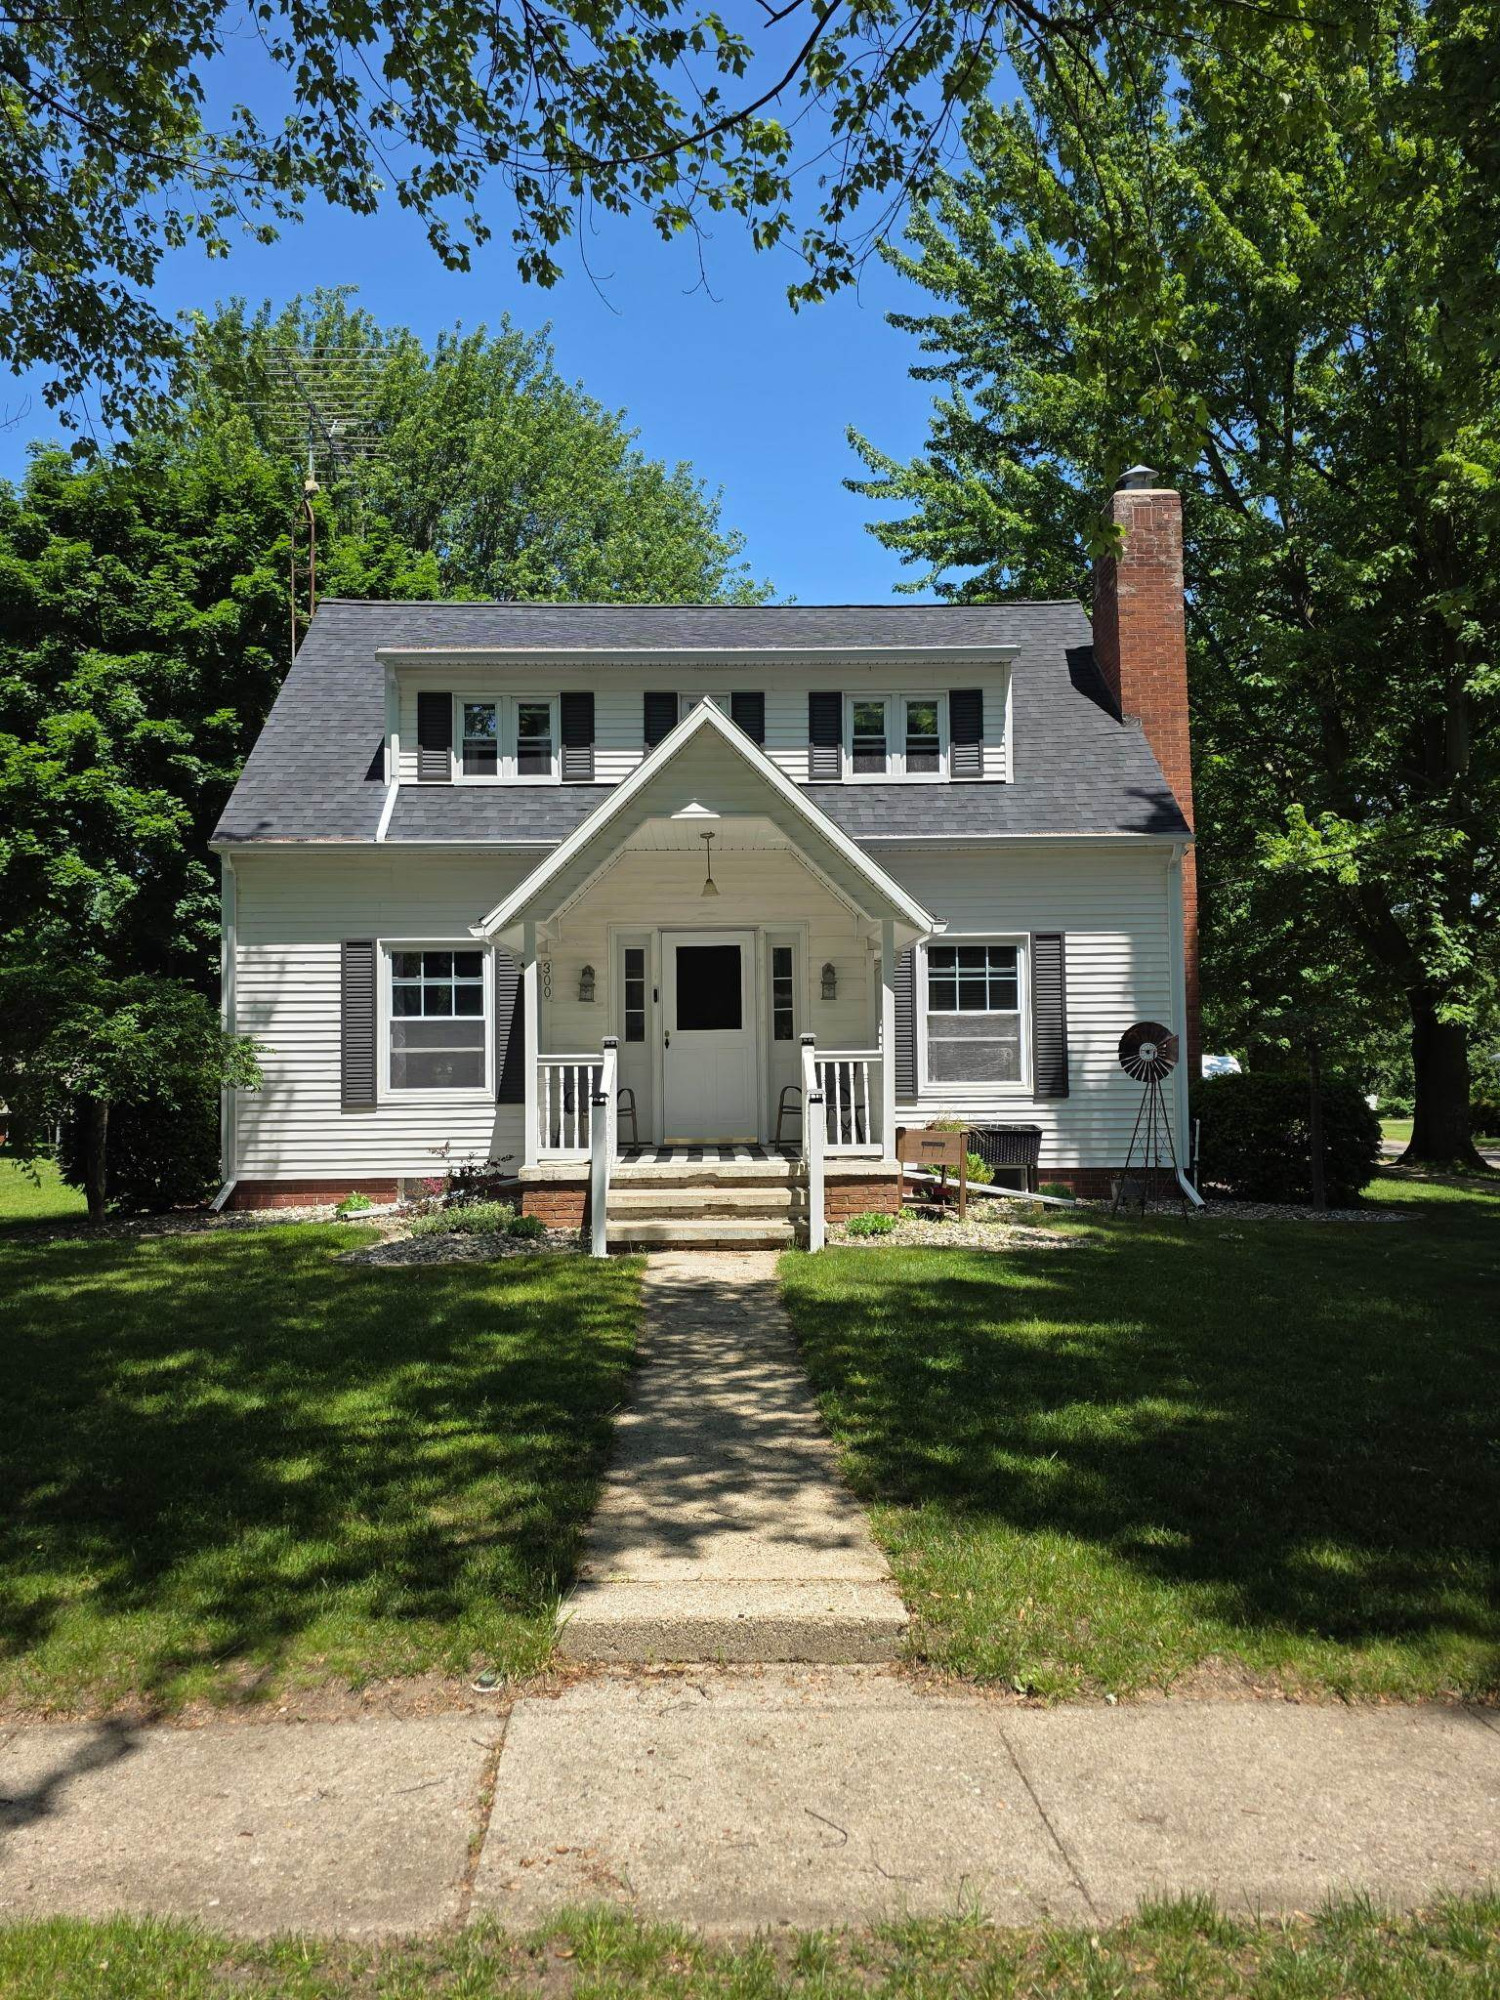
1/40
$284,900
300 Brady Street, Chesaning, MI 48616
4 bd4 ba0.26 ac
Single Family
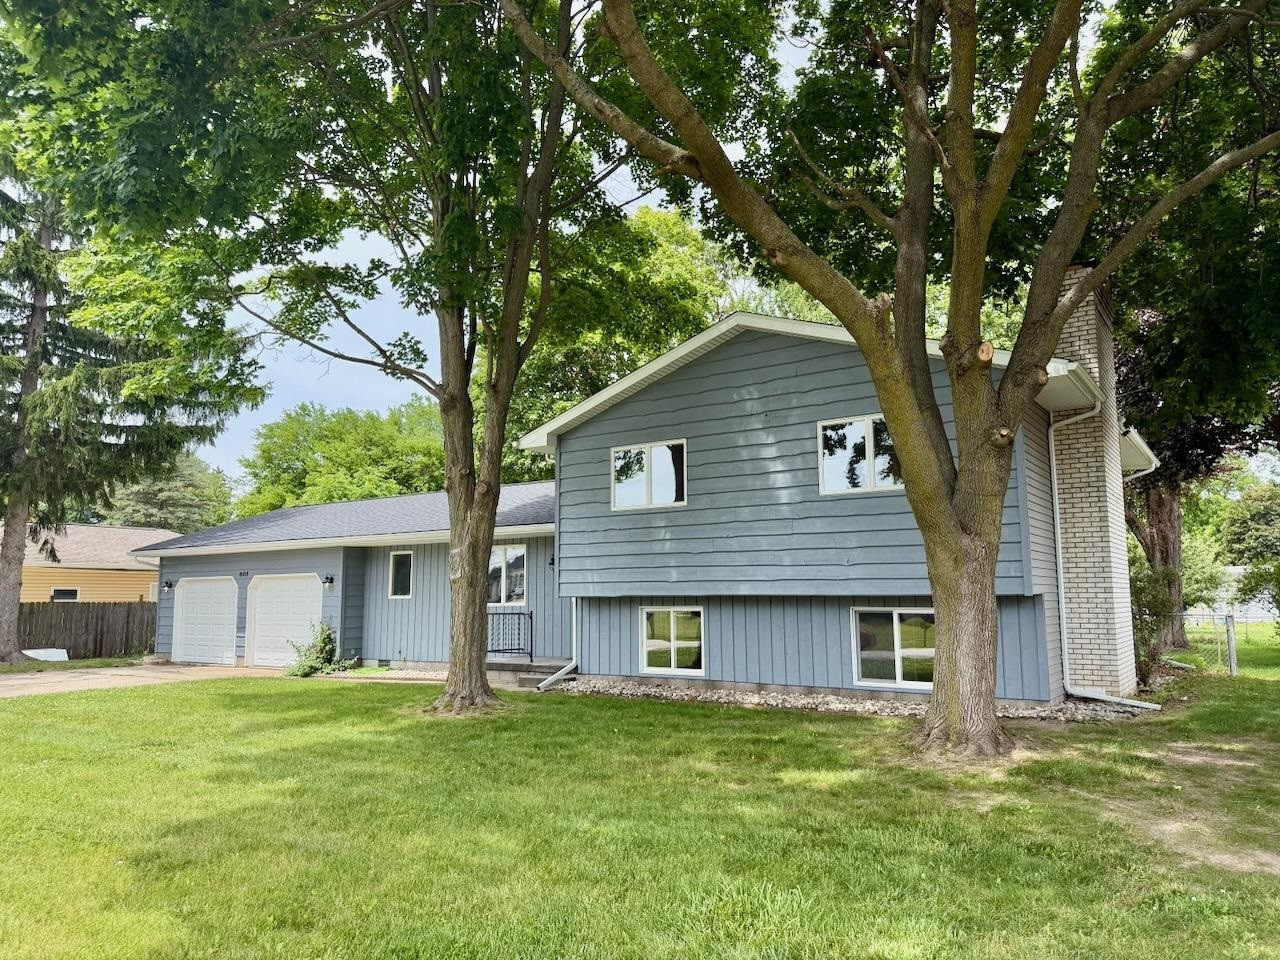
For Sale
1/42
$249,900
605 E Liberty Street, Chesaning, MI 48616
3 bd2 ba0.30 ac
Single Family
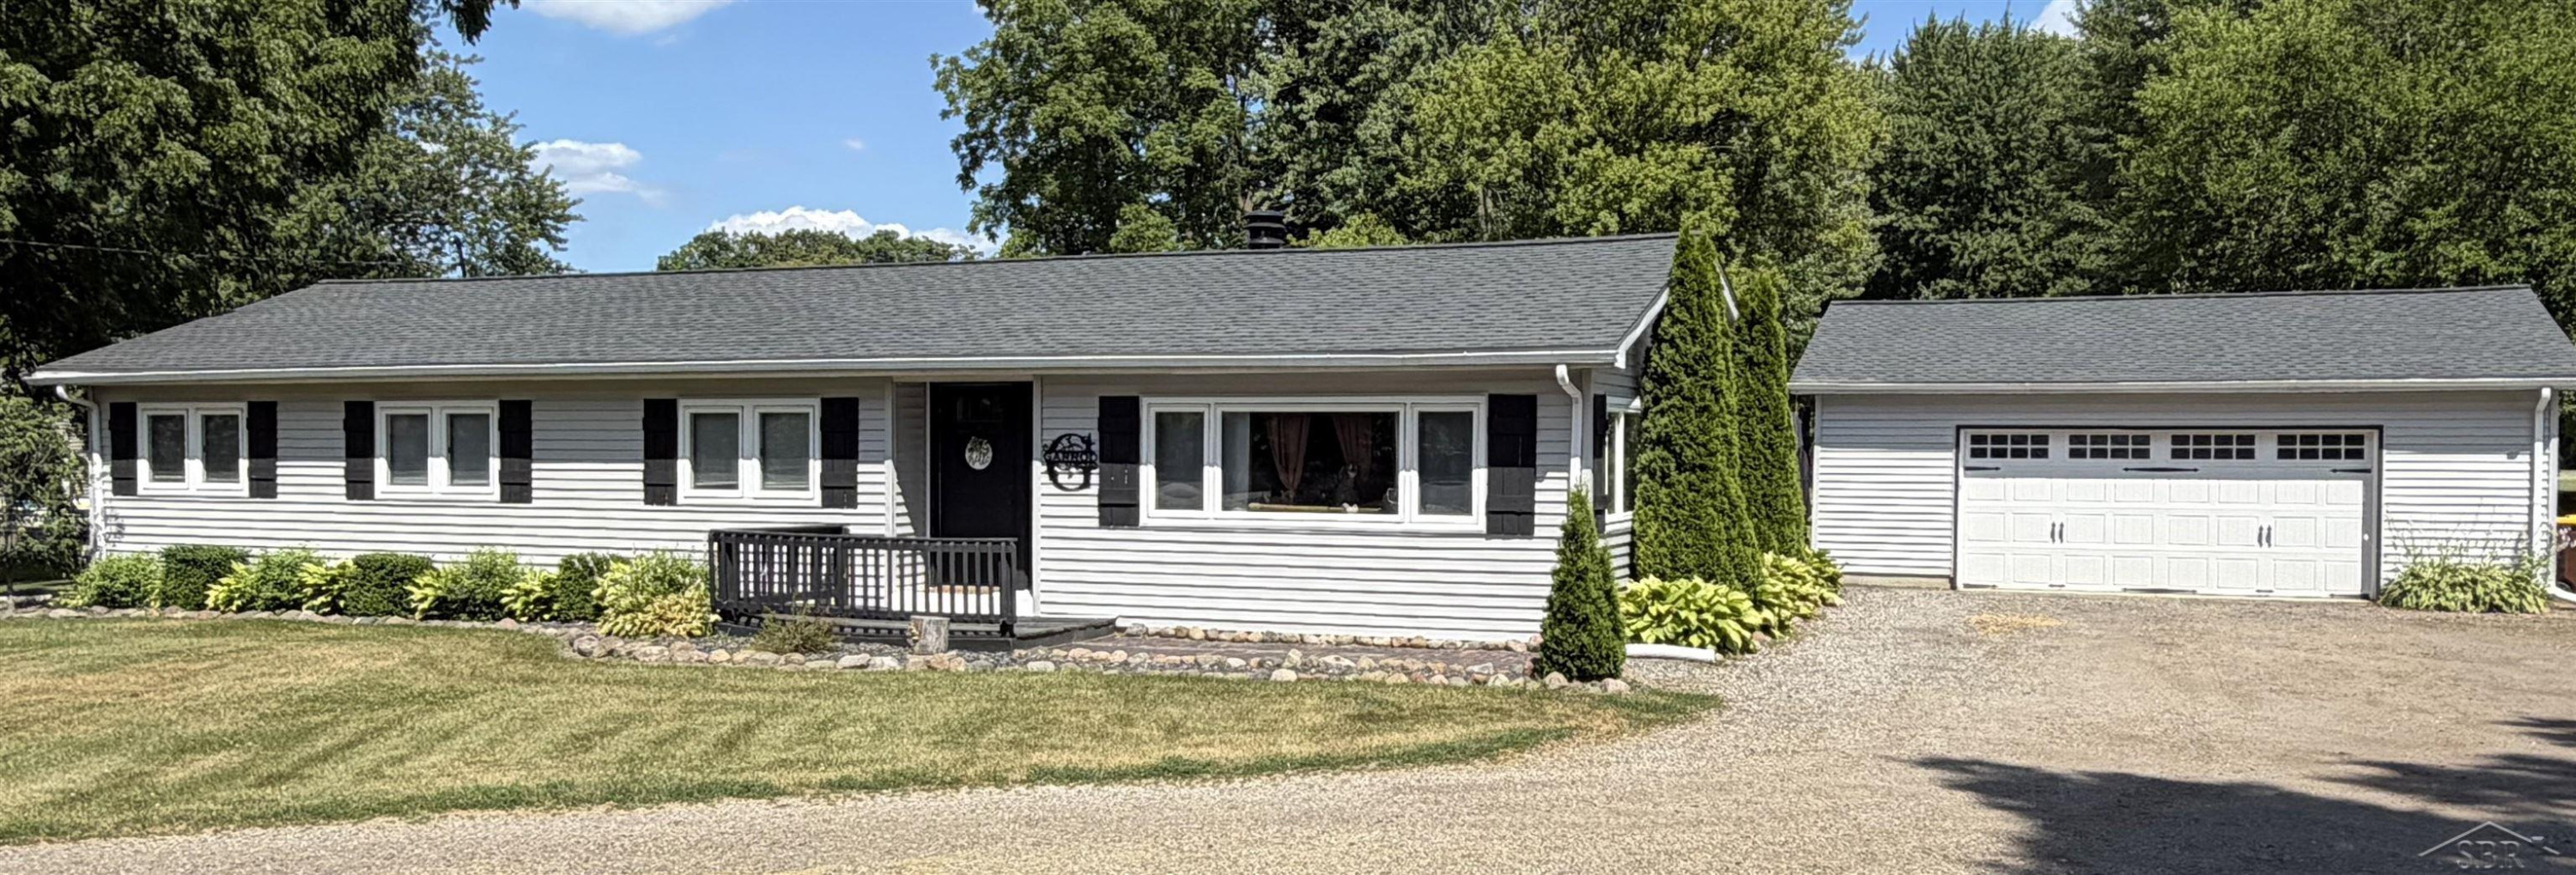
For Sale
1/27
$189,900
325 S Main Street, Chesaning, MI 48616
3 bd2 ba2.24 ac
Single Family
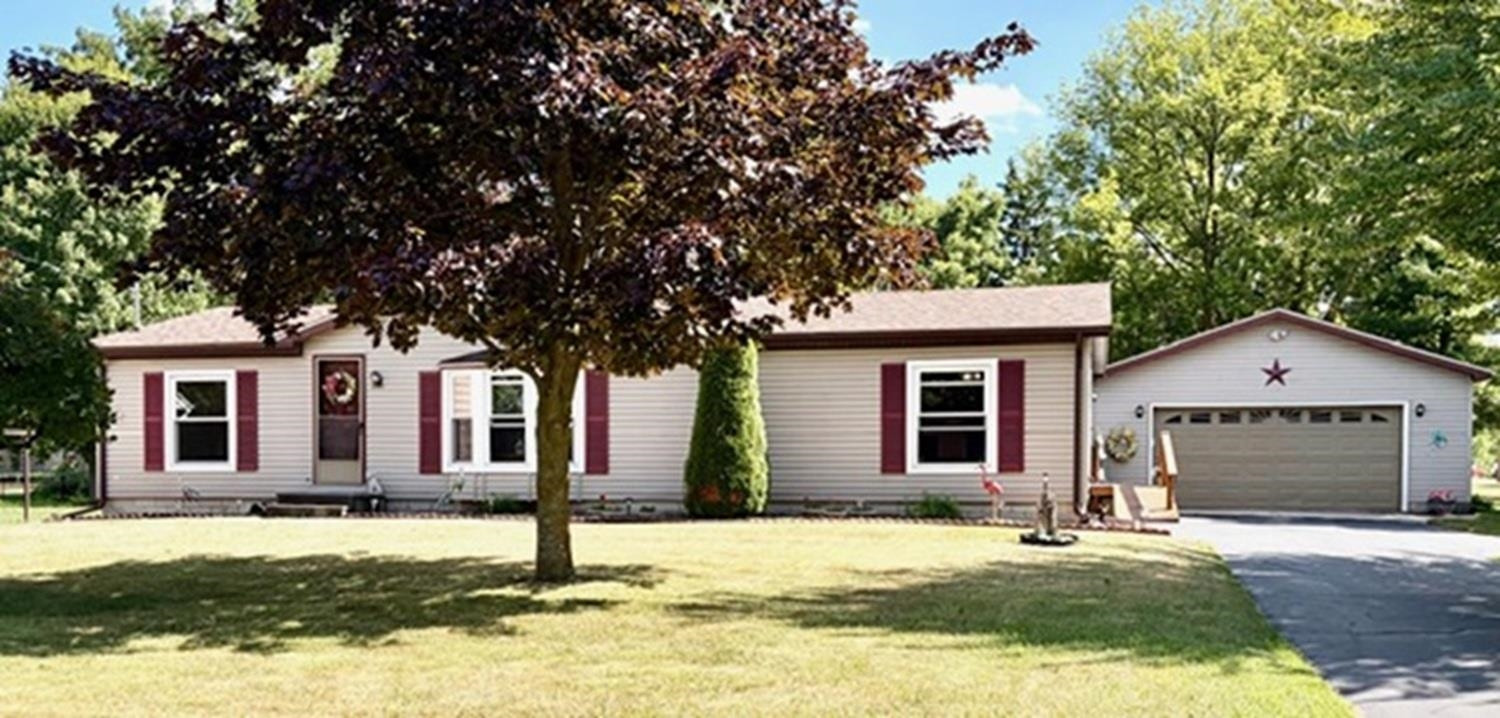
For Sale
1/21
$174,900
608 E Liberty Street, Chesaning, MI 48616
3 bd2 ba0.35 ac
Single Family
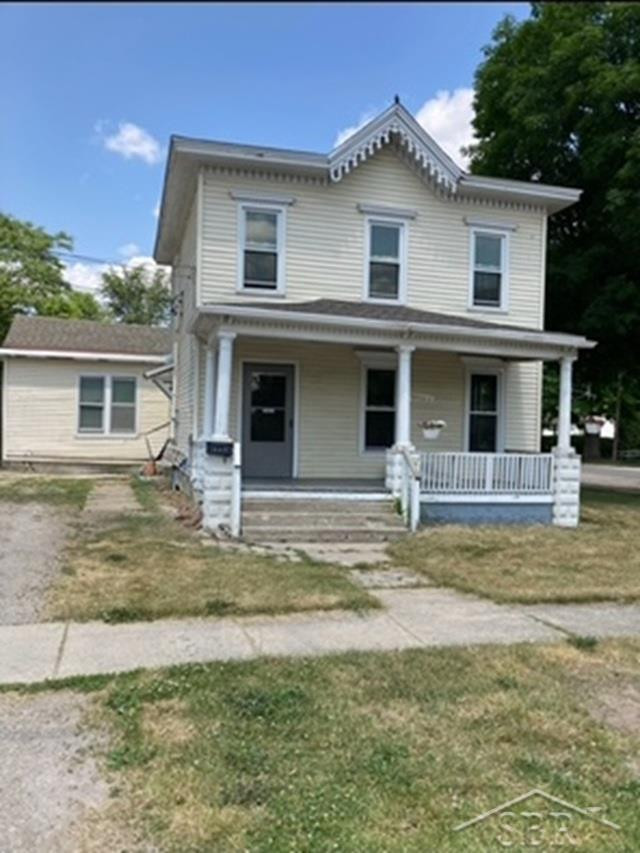
For Sale
1/23
$154,900
307 N Line Street, Chesaning, MI 48616
Built 19000.24 ac
Multi-Fam
For Sale
1/21
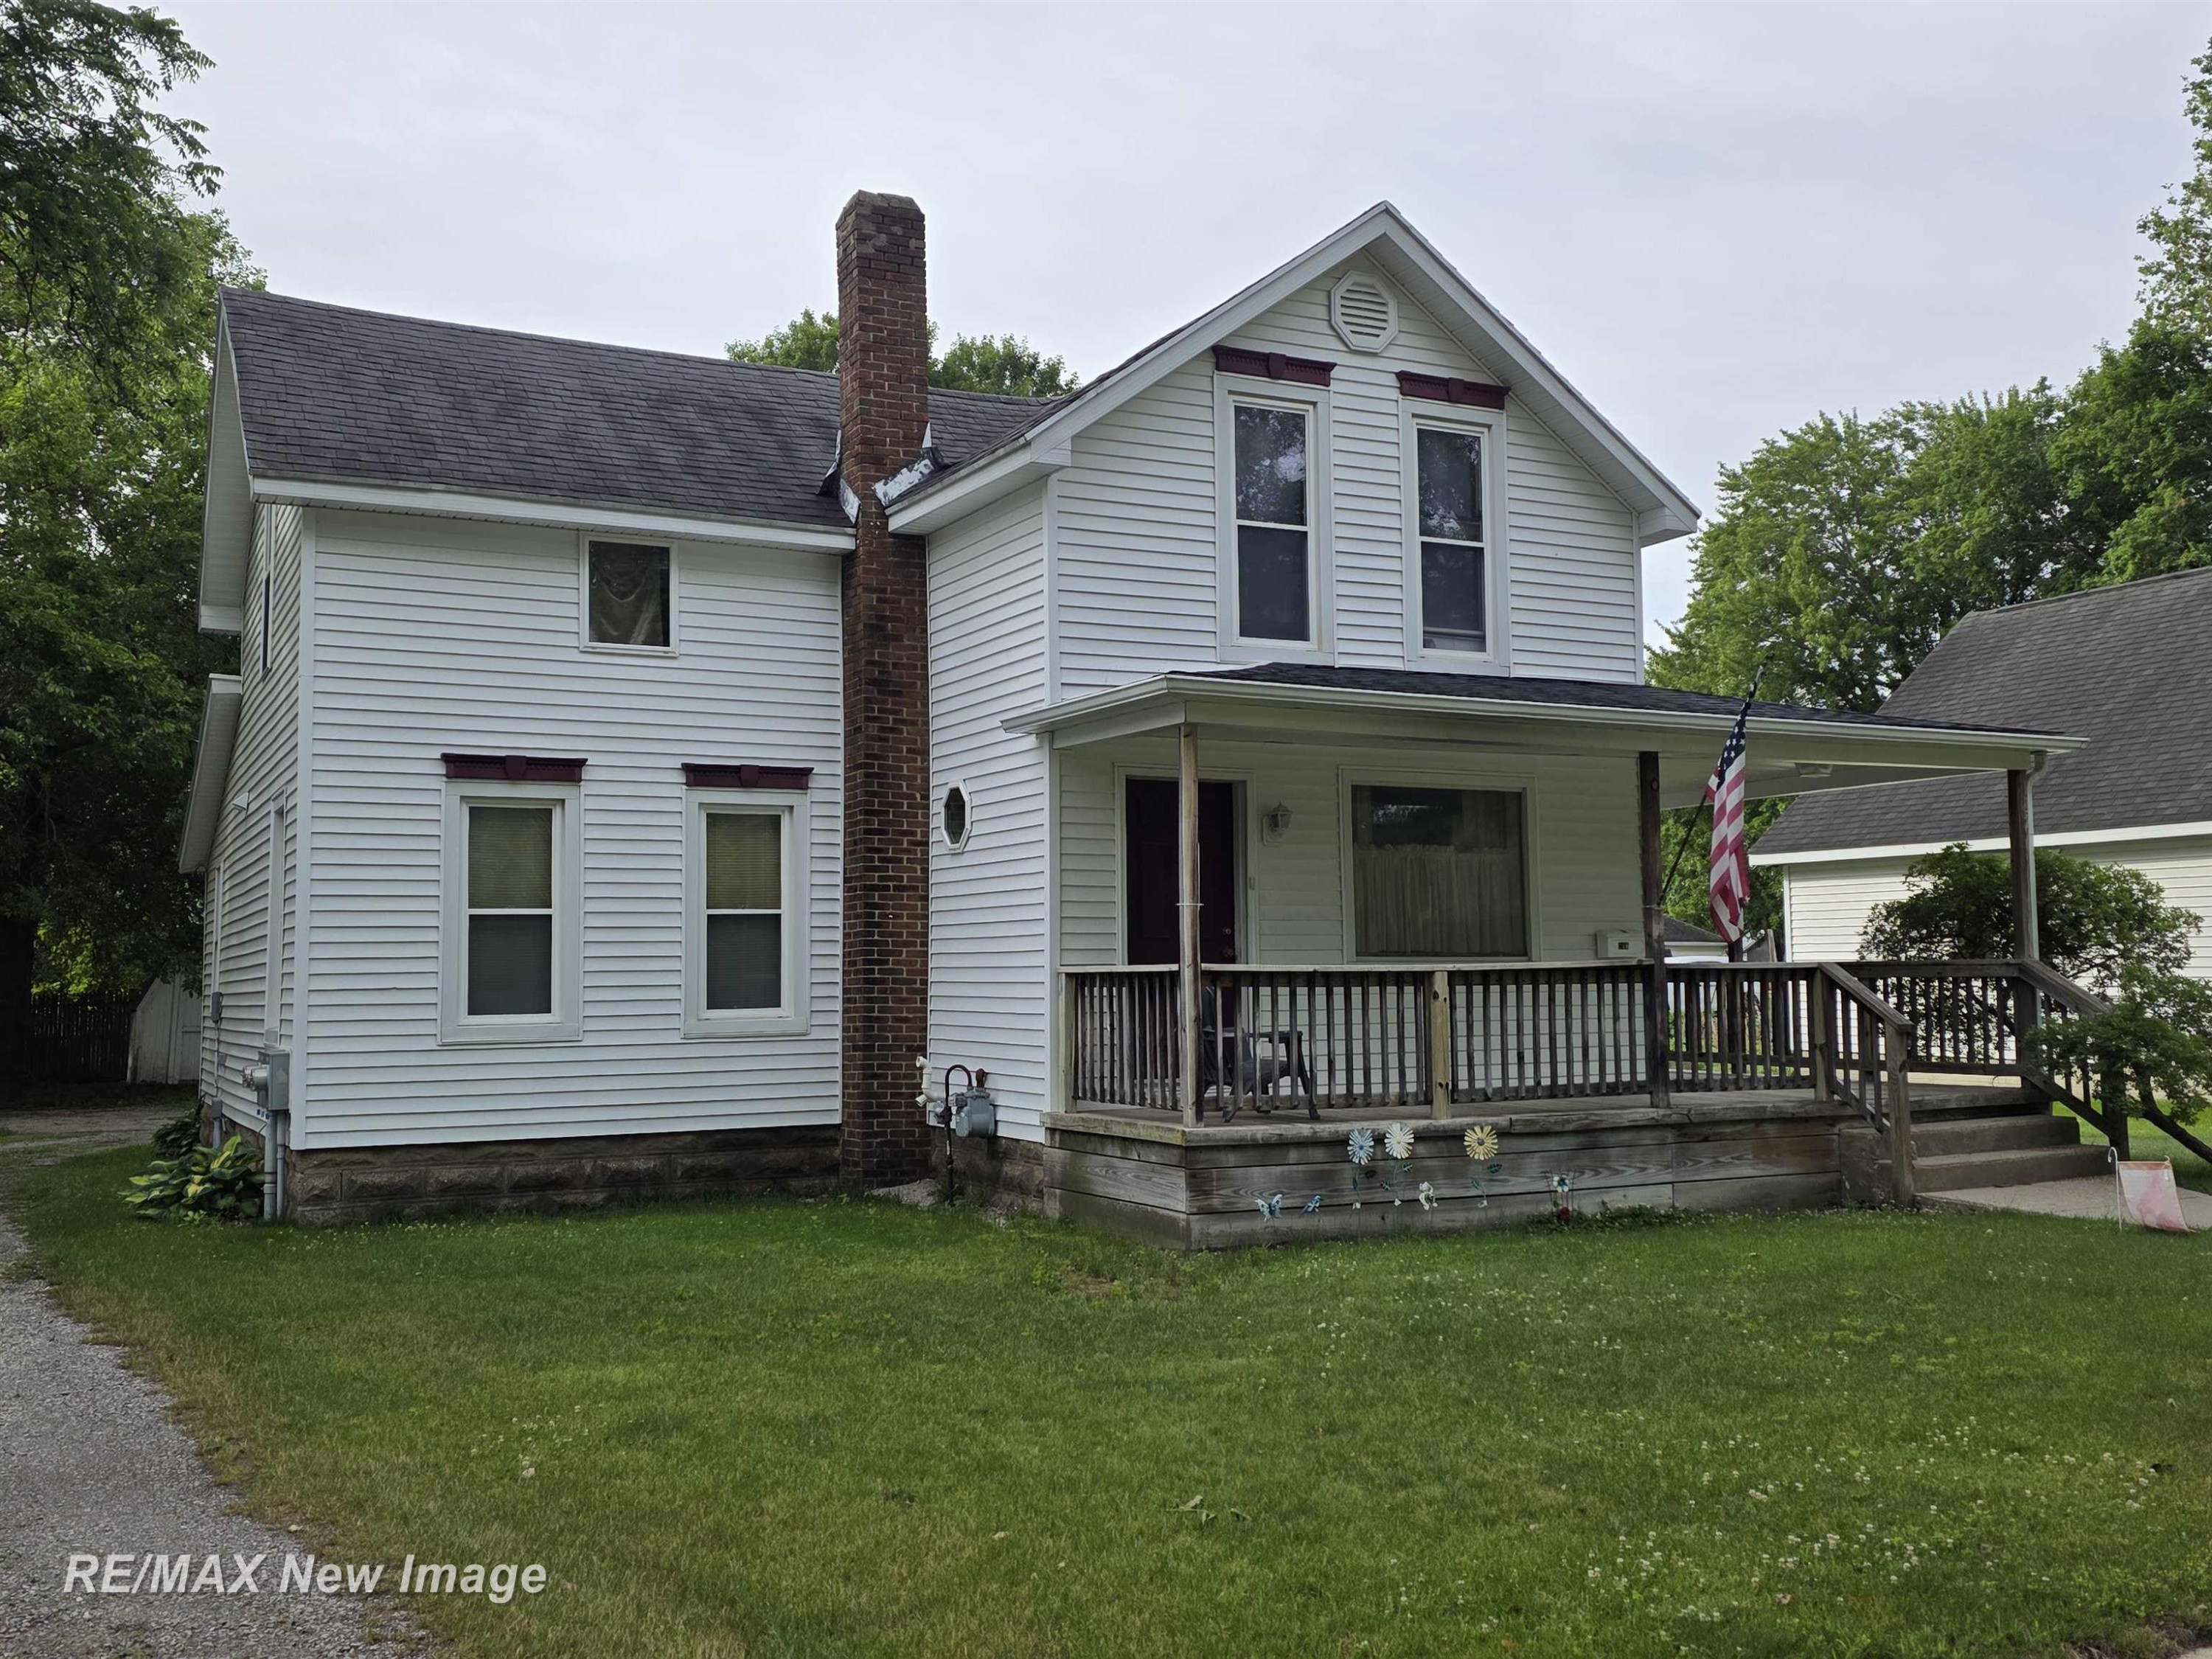
$129,000
218 Lincoln Street, Chesaning, MI 48616
Built 19200.20 ac
Multi-Fam
For Sale
1/43
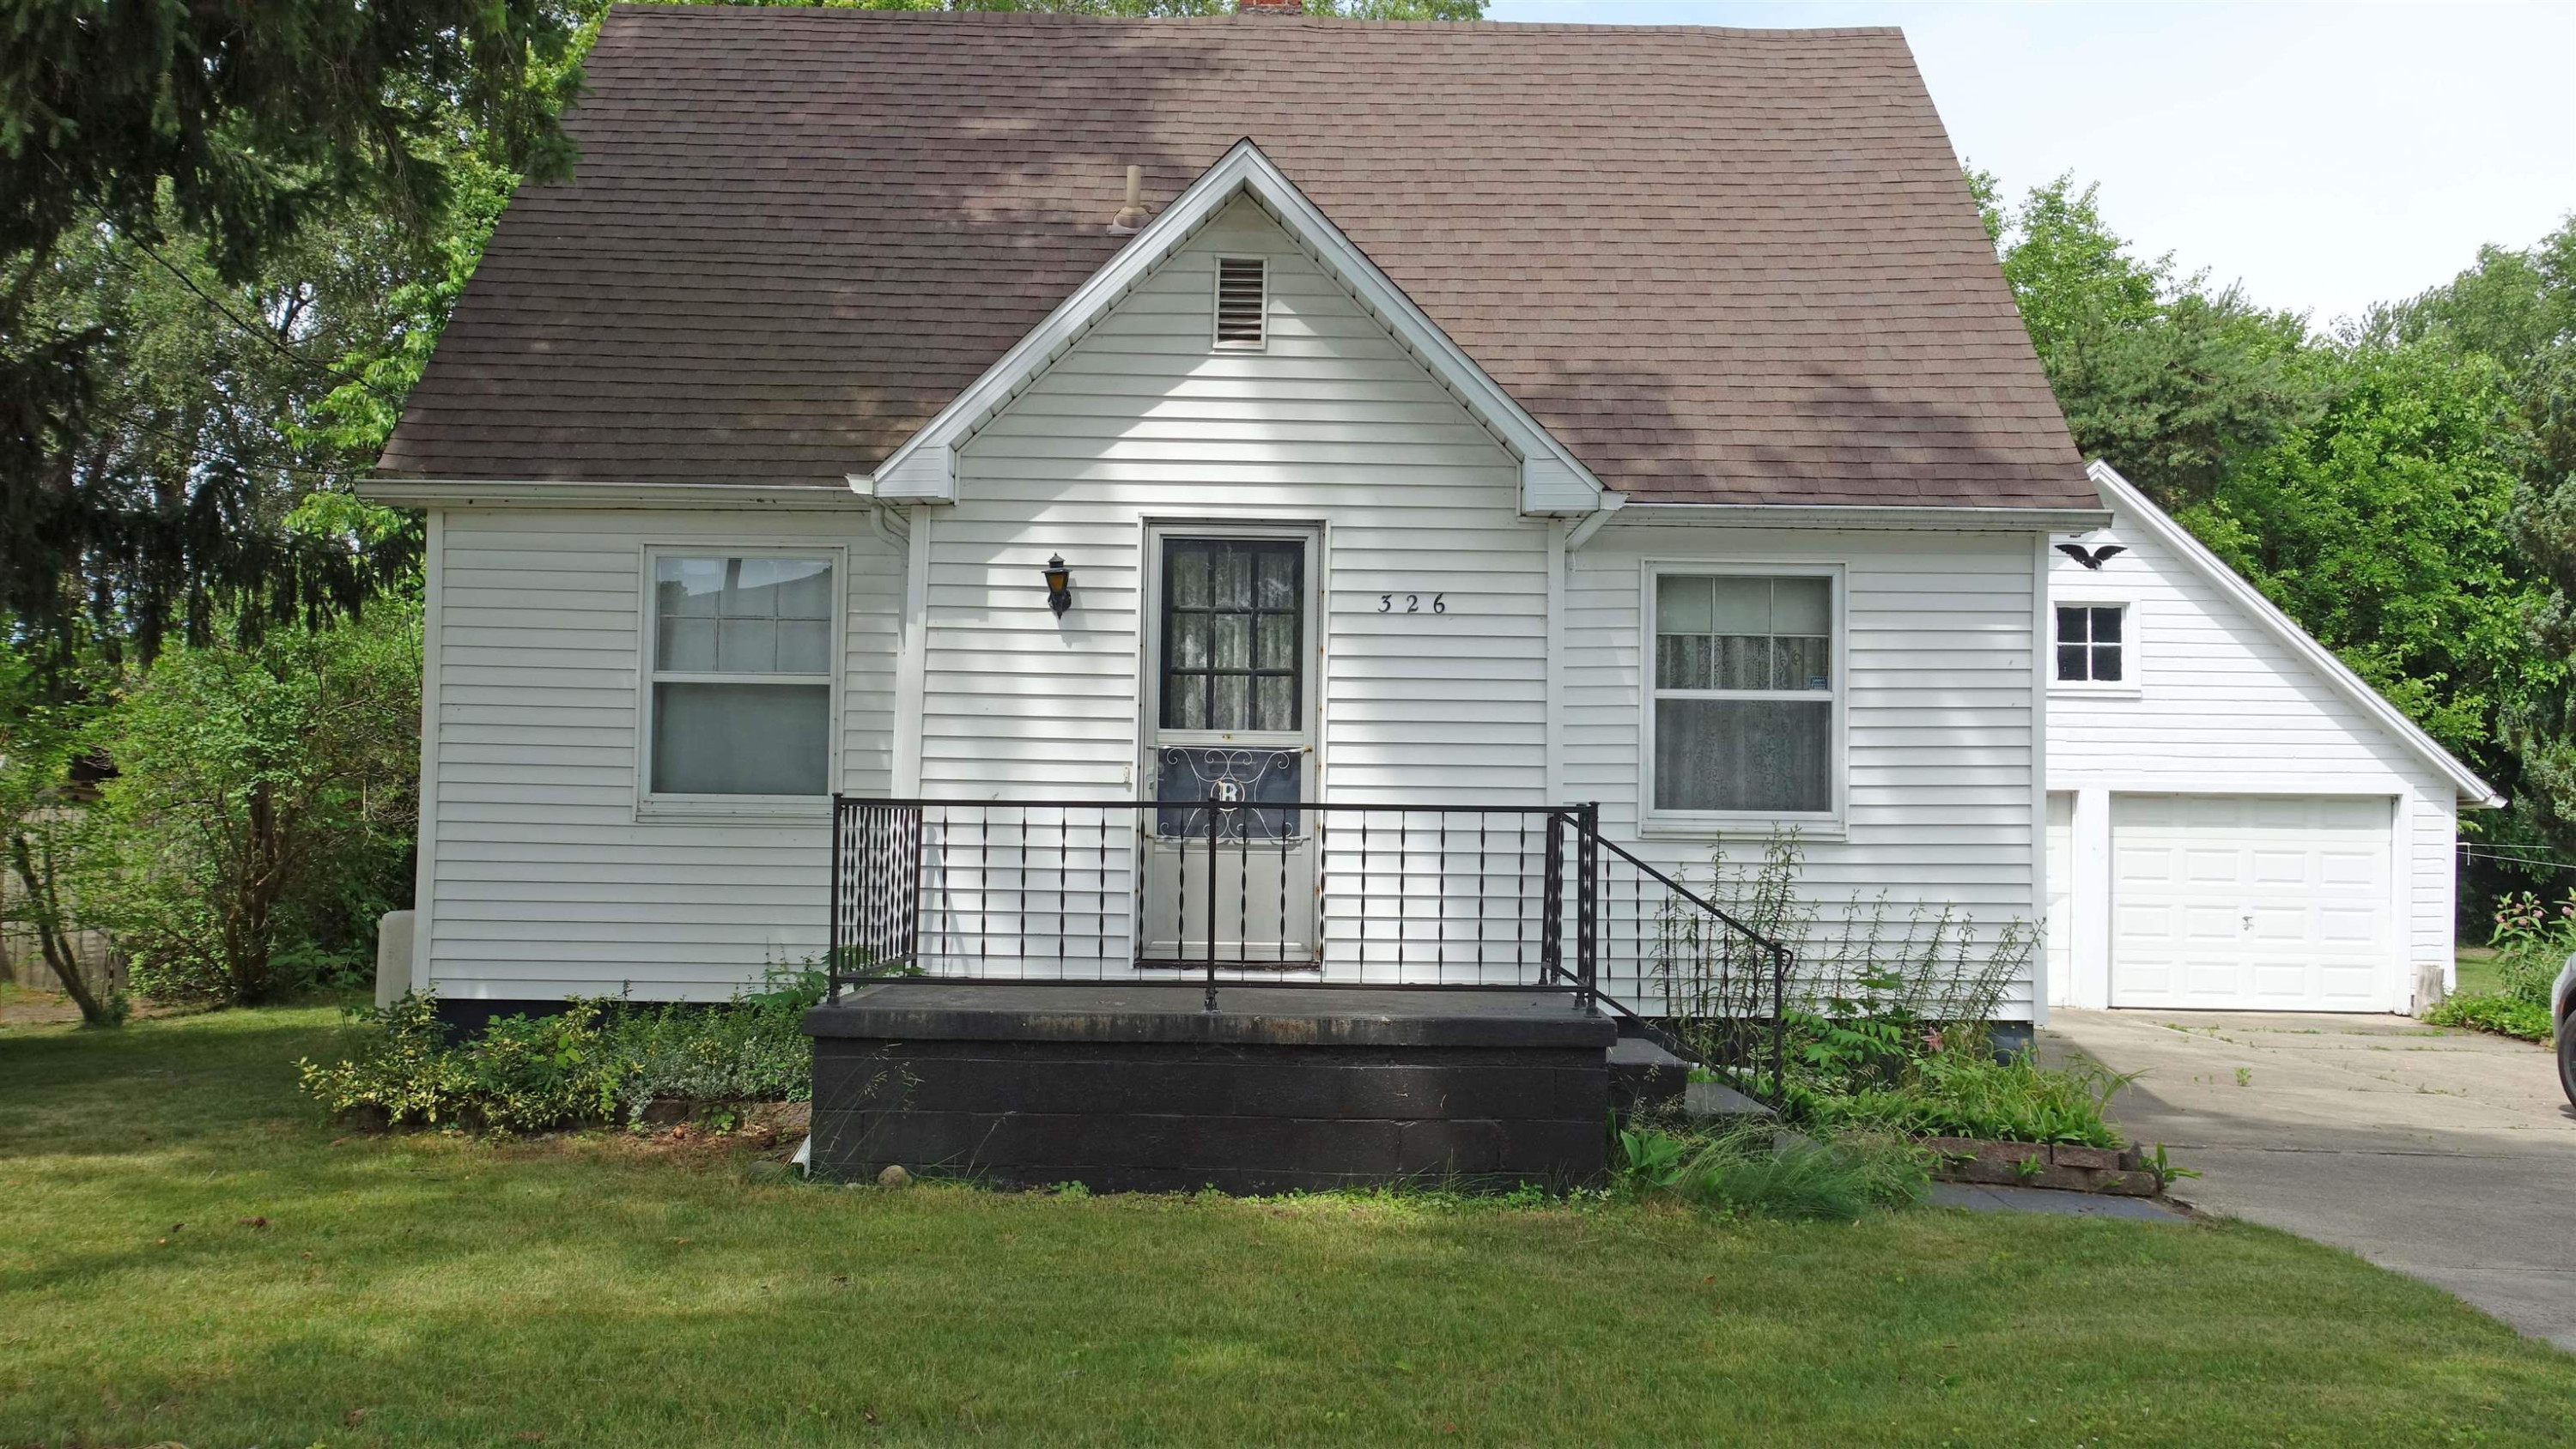
$124,900
326 S Clark Street, Chesaning, MI 48616
3 bd2 ba0.20 ac
Single Family
For Sale
1/43
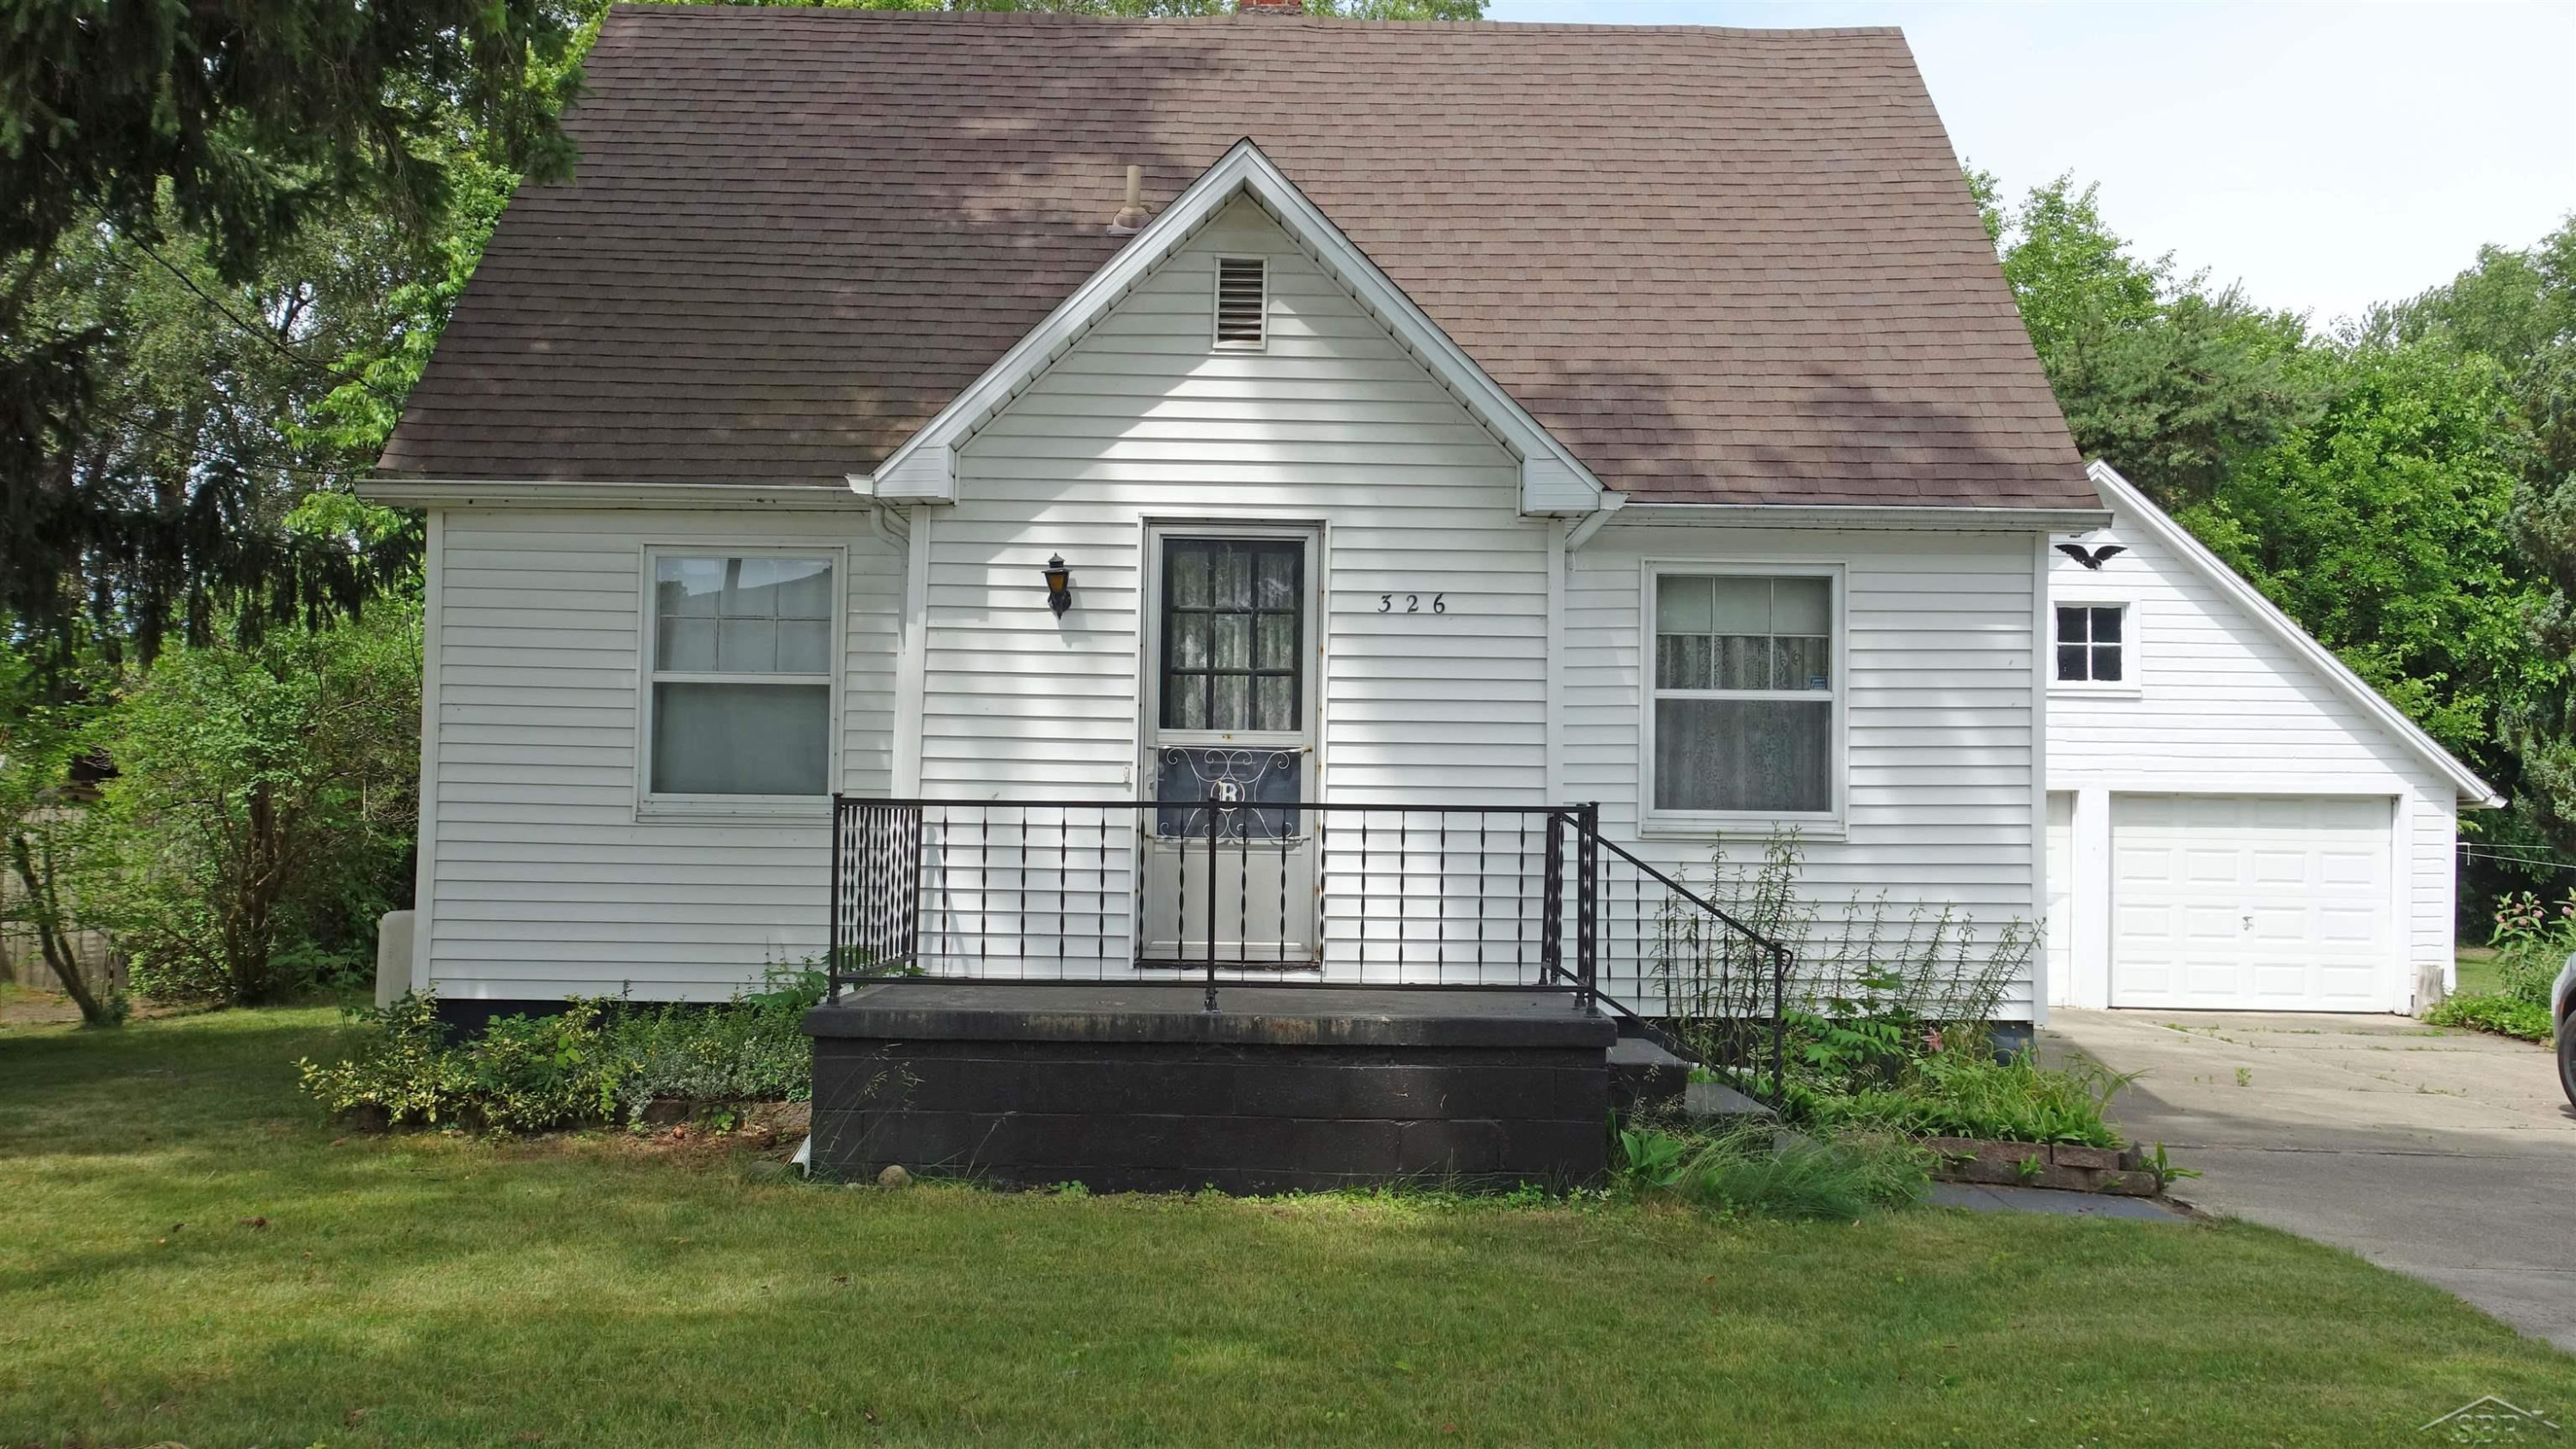
$124,900
326 S Clark Street, Chesaning, MI 48616
3 bd2 ba0.20 ac
Single Family
For Sale
1/27
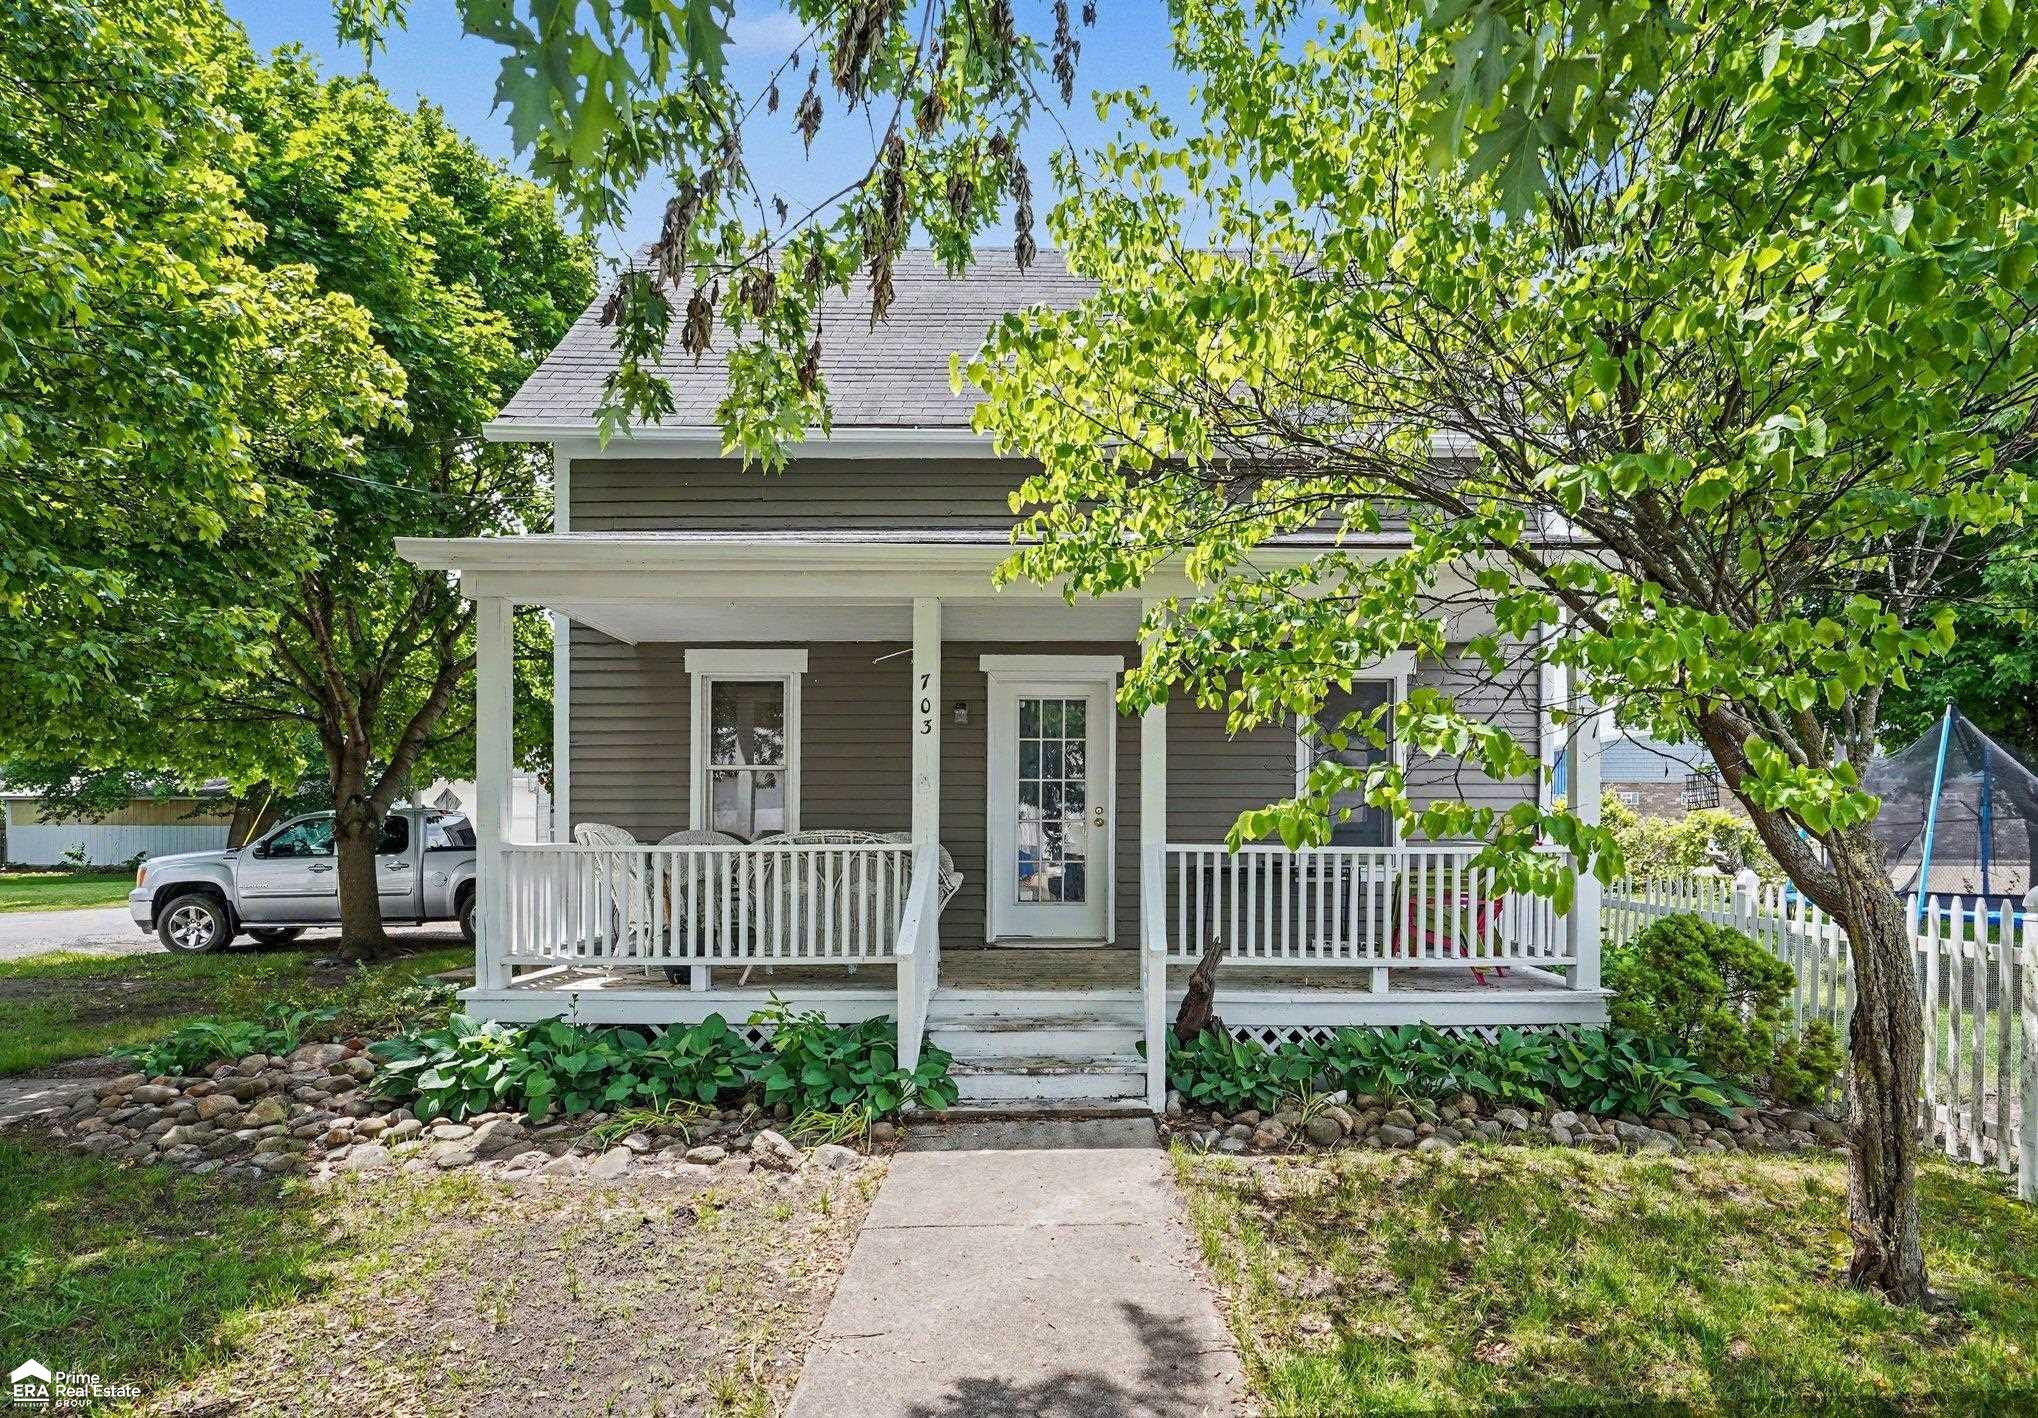
$119,900
703 Brady Street, Chesaning, MI 48616
3 bd1 ba0.13 ac
Single Family
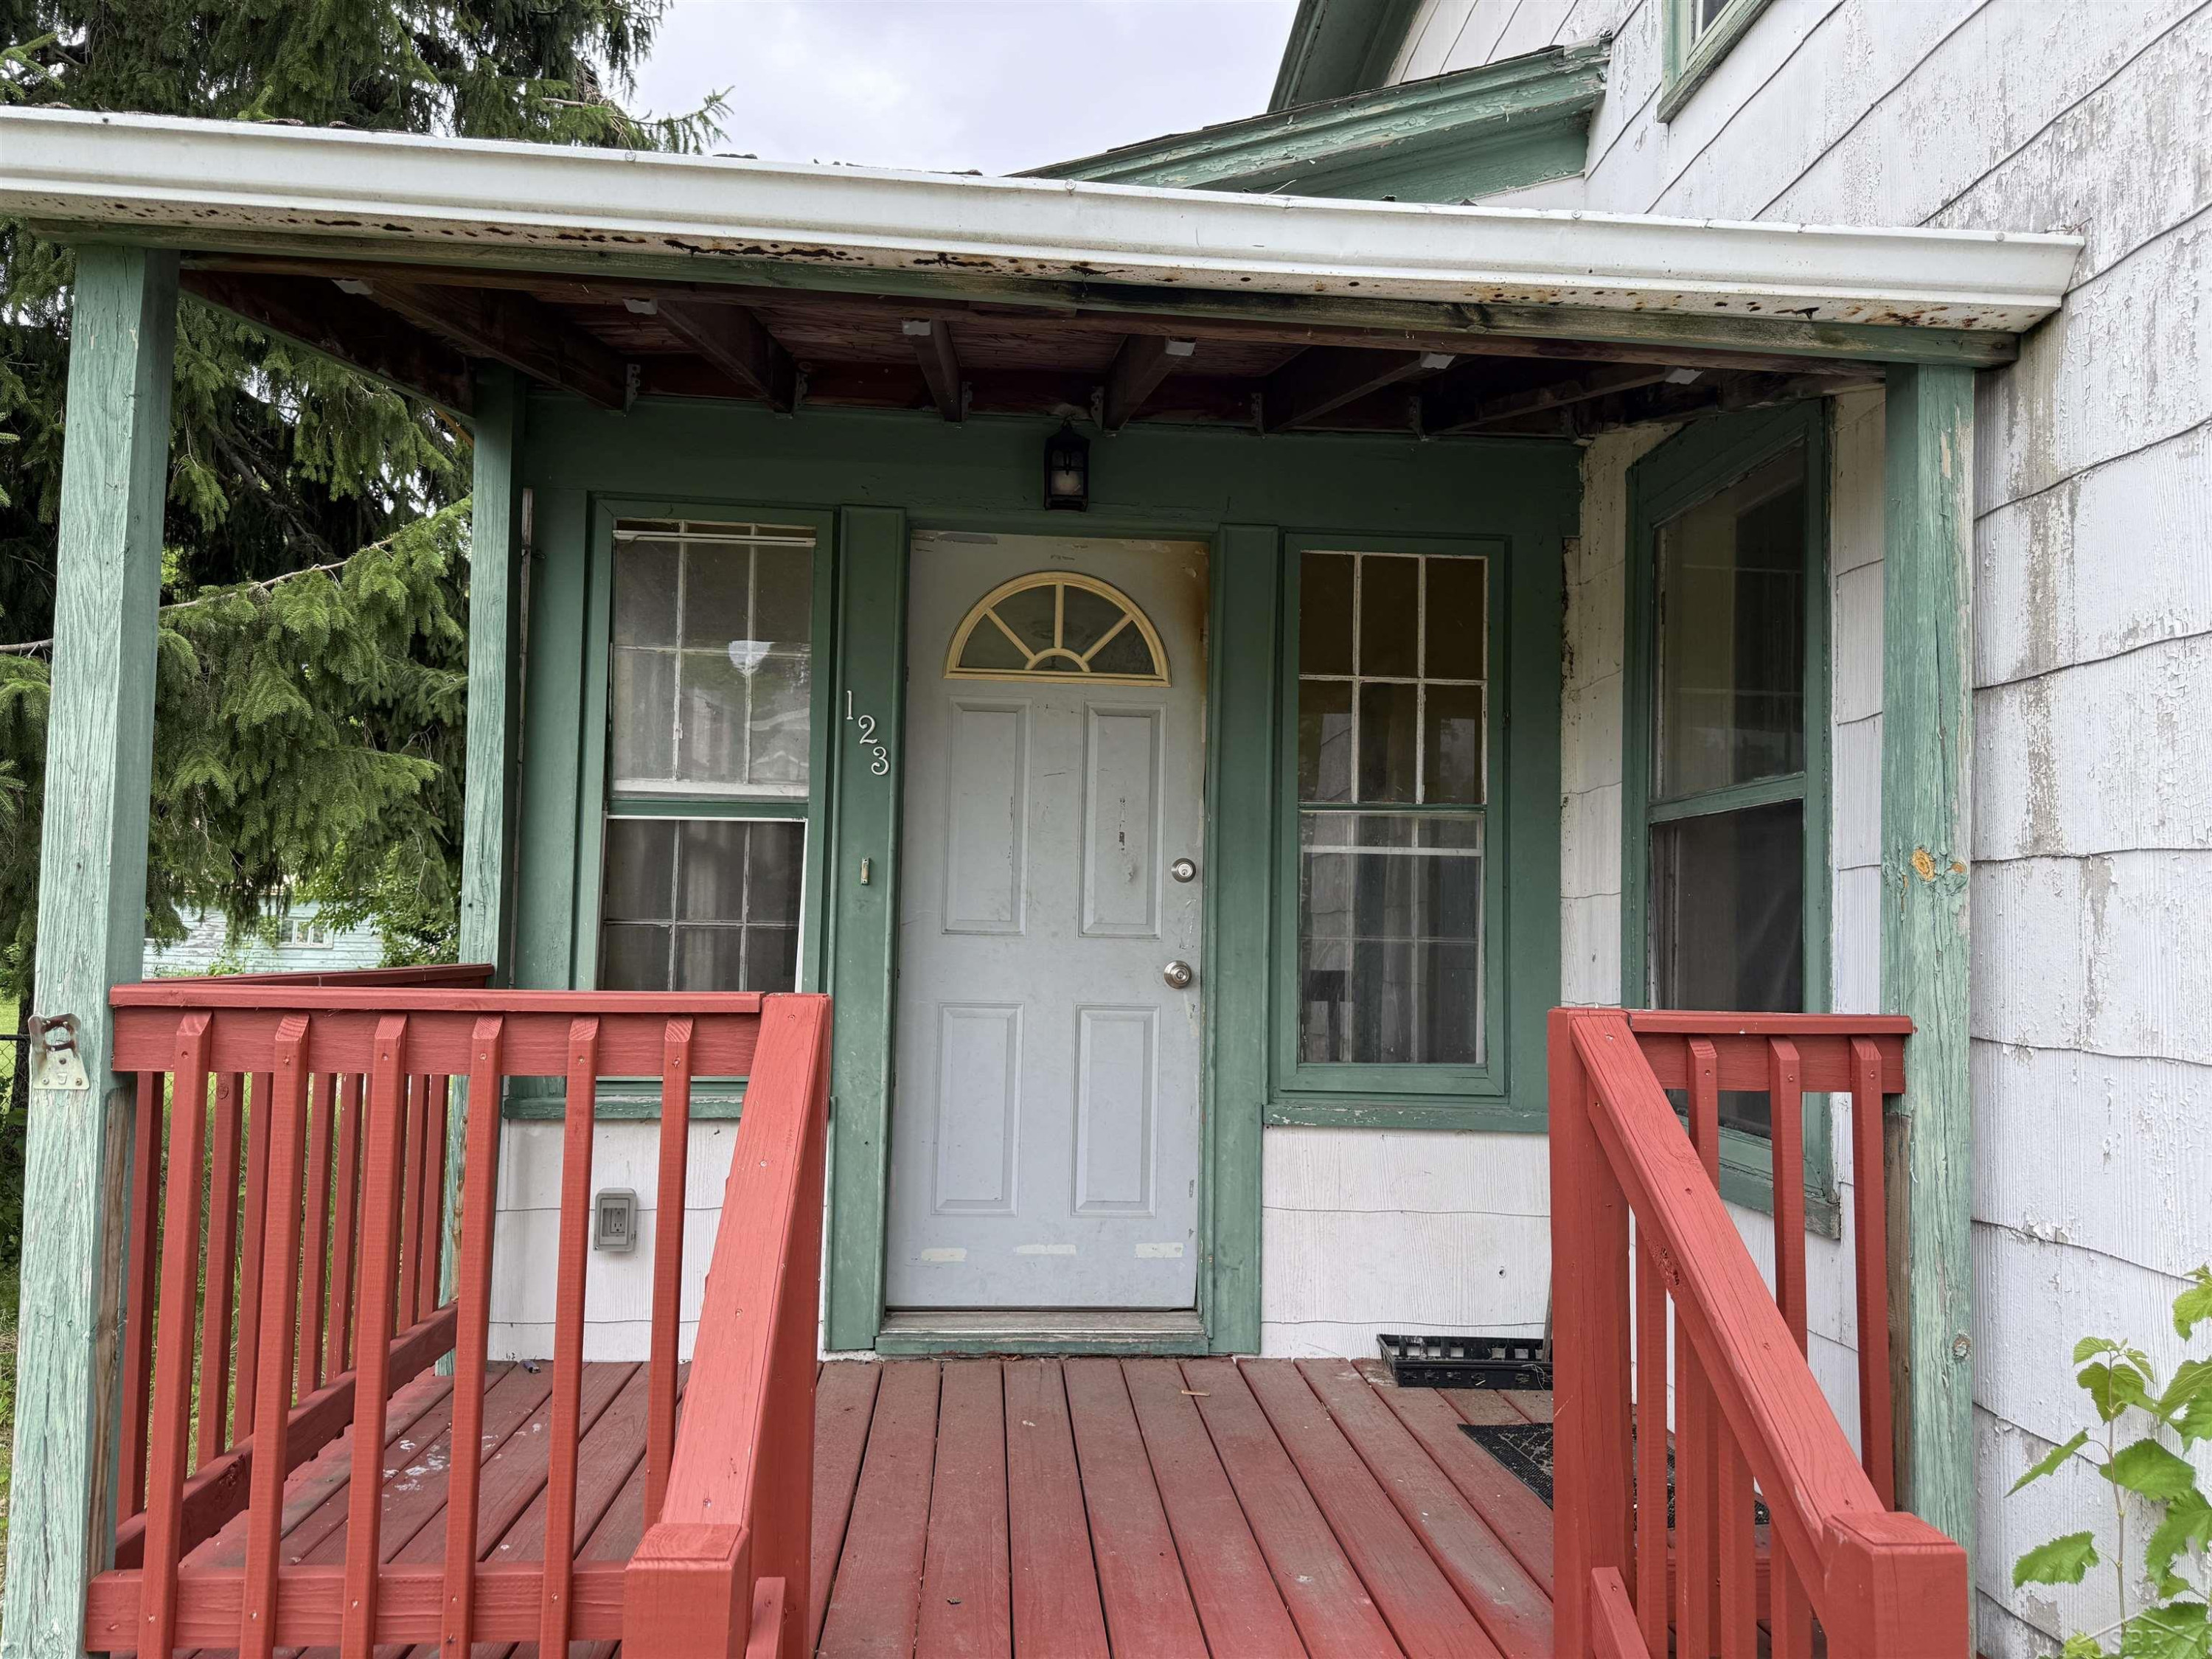
Under Contract
1/19
$73,500
123 N Clark Street, Chesaning, MI 48616
3 bd2 ba0.19 ac
Single Family
Recently Sold(47)
Frequently Asked Questions about Chesaning Twp
Are there homes available in Chesaning Twp right now?
Chesaning Twp currently has 14 homes listed for sale. The median asking price is $182,400.
How much do homes cost in Chesaning Twp?
The median sale price in Chesaning Twp is $182,400, based on 47 closed sales over the past 12 months.
How long do homes stay on the market in Chesaning Twp?
Homes in Chesaning Twp sell in an average of 70 days, based on 47 sales over the past 12 months.
What schools are in Chesaning Twp?
Chesaning Twp is served by one or more public school districts. In Michigan, school district boundaries do not always align with city limits, so different parts of Chesaning Twp may be zoned for different districts. Check individual listings for the specific school district assignment.
What are market conditions like in Chesaning Twp?
With 3.6 months of inventory, Chesaning Twp is currently a balanced market. This is based on 14 active listings and 47 sales in the past 12 months.
What are property taxes like in Chesaning Twp?
Michigan property taxes in Chesaning Twp are calculated using the State Equalized Value (SEV) times the local millage rate. Rates vary by school district and municipality. Primary residences qualify for a homestead exemption that reduces the tax rate.
Is housing demand growing in Chesaning Twp?
Per U.S. Census ACS data, Chesaning Twp has a +5.0% Household Formation Gap over the past 15 years. Average household size decreased from 2.37 to 2.35, creating demand for approximately 49 additional housing units even as population grew 4.1%. HFG is a secondary market indicator — it reflects demographic trends, not a primary measure like income-based affordability.